

Widespread and specific tips for creating a graph
Abstract
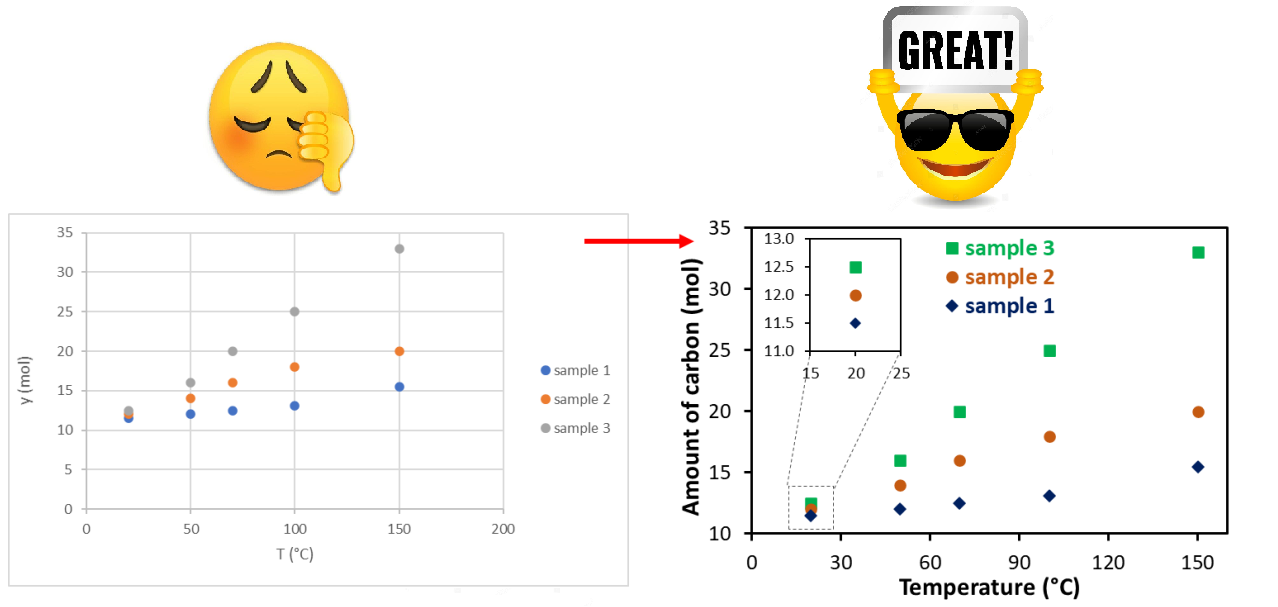
It is widely evident that contemporary scholar journals serve as a platform for exchange and discussion of new scientific results among various groups of people, including scientists, students, company representatives, governments, and others. To provide more insights into a problem stated and potential solutions, the authors usually provide their experimental and theoretical results with several specific items (tables, schemes, and graphs). Such a representation is intended to make more robust assumptions, to reveal relationships more clearly, to support formulated conclusions; obviously, many of these things are challenging to present and discuss solely in the form of text without any illustrations [1]. Furthermore, graphical elements assume a pivotal role in capturing the reader's attention in a dynamic and rapidly evolving environment [2].
Keywords
Full Text:
PDFReferences
Editorial. A figure is worth a thousand words, Nat Rev Psychol. 2024;3:139–139. doi:10.1038/s44159-024-00292-2
Hmeljak J, Hooper K. The importance of figures in scientific ‘show and tell’, Dis Models Mech. 2023;16: dmm050545. doi:10.1242/dmm.050545
Buriak JM. Figure size: please be kind to your reader, Chem Mater. 2017;29:8021–8022. doi:10.1021/acs.chemmater.7b04002
Kamat PV. The lost art of composing single-panel figures, ACS Energy Lett. 2022;7:2407–2409. doi:10.1021/acsenergylett.2c01441
Buriak JM. Which font looks best in a figure?, Chem Mater. 2016;28:689–690. doi:10.1021/acs.chemmater.6b00306
Plante TB, Cushman M. Choosing color palettes for scientific figures, Res Pr Thromb Haemost. 2020;4:176–180. doi:10.1002/rth2.12308
DOI: https://doi.org/10.15826/chimtech.2025.12.2.E1
Copyright (c) 2025 Chimica Techno Acta

This work is licensed under a Creative Commons Attribution 4.0 International License.
![]()
![]()
![]()
![]()
![]()
![]()
Chimica Techno Acta, 2014–2025
eISSN 2411-1414
Copyright Notice